Integrating Chart.js into Your Nuxt.js Web Application Dashboard
Adding Graph Charts Library into your Nuxt.js Vuetify Web Application Dashboard with Chart.js open-source JavaScript library for data visualization
 Web Story
Nuxt.js Web Application Development that requires Graph Chart to be included
When you have a task to put a graph chart in your Nuxt.js web development project, preparation to include a graph chart library might be overwhelming at first. There are many graph chart libraries available and this writing is about one of them which is Chart.js which has various graph charts libraries that might become handy on your Nuxt.js web development tasks.
Why Chart.js and Nuxt.js
There are many free open-source graph chart libraries that you can use and integrate into your Nuxt.js web application, one of them is Chart.js.
Chart.js is an open-source JavaScript library for data visualization and has a default configuration to put in Vue.js. Nuxt.js requires you to include Chart.js as a plugin not as a module. Below is how to include Chart.js in the Nuxt.js web application:
- Write a file named
chart.jsinside the Nuxt.js./plugins/directory and write all the necessary graph charts from chart.js to be used in your Nuxt.js web application.
/* eslint-disable vue/one-component-per-file */
import Vue from 'vue'
import { Bar, Line, Doughnut, Pie } from 'vue-chartjs/legacy'
import {
  Chart as ChartJS,
  Title,
  Tooltip,
  Legend,
  BarElement,
  CategoryScale,
  LinearScale,
  LineElement,
  PointElement,
  ArcElement
} from 'chart.js'

ChartJS.register(
  Title,
  Tooltip,
  Legend,
  PointElement,
  BarElement,
  CategoryScale,
  LinearScale,
  LineElement,
  ArcElement
)

Vue.component('LineChart', {
  extends: Line
})

Vue.component('DoughnutChart', {
  extends: Doughnut
})

Vue.component('BarChart', {
  extends: Bar
})

Vue.component('PieChart', {
  extends: Pie
})
- Include the
chart.jsplugins into the Nuxt.js configuration in thenuxt.config.jsfile with theclientmode:
export default {
  ...
  target:'static',
  ...
  // Plugins to run before rendering page: https://go.nuxtjs.dev/config-plugins
  plugins: [
    { src: '~/plugins/chart.js', mode: 'client' },
    { src: '~/plugins/axios.js' }
  ]
}
- Include all the graph chart data that came from CMS or your Restful API endpoints and the chart options in the pages that require you to use Chart.js like this sample below:
<script>
export default {
  name: 'IndexPage',
  data() {
    return {
      doughChartData: {
        labels: ['NuVue', 'VueJit', 'IftShi', 'KoinVi', 'MegsWear', 'Millgh'],
        datasets: [
          {
            label: 'Visualization',
            data: [72, 131, 12, 3, 4, 55],
            backgroundColor: [
              'rgba(20, 255, 0, 0.85)',
              'rgba(200, 5, 0, 0.85)',
              'rgba(10, 220, 0, 0.85)',
              'rgba(2, 100, 0, 0.85)',
              'rgba(20, 55, 0, 0.85)',
              'rgba(120, 155, 0, 0.85)'
            ],
            borderColor: 'rgba(100, 155, 0, 1)',
            borderWidth: 0
          }
        ]
      },
      doughChartOptions: {
        responsive: true,
        maintainAspectRatio: false,
        offset: 8,
        radius: 160,
        spacing: 4,
        hoverOffset: 32,
        hoverBorderWidth: 1,
        weight: 0
      }
    }
  }
}
</script>
- Render the graph chart in the page components like this one below:
<template>
  <client-only placeholder="Loading...">
    <DoughnutChart
      :chart-data="doughChartData"
      :chart-options="doughChartOptions"
      :height="430"
    />
  </client-only>
</template>
- Reconfigure if needed in the options or the graph chart data itself.
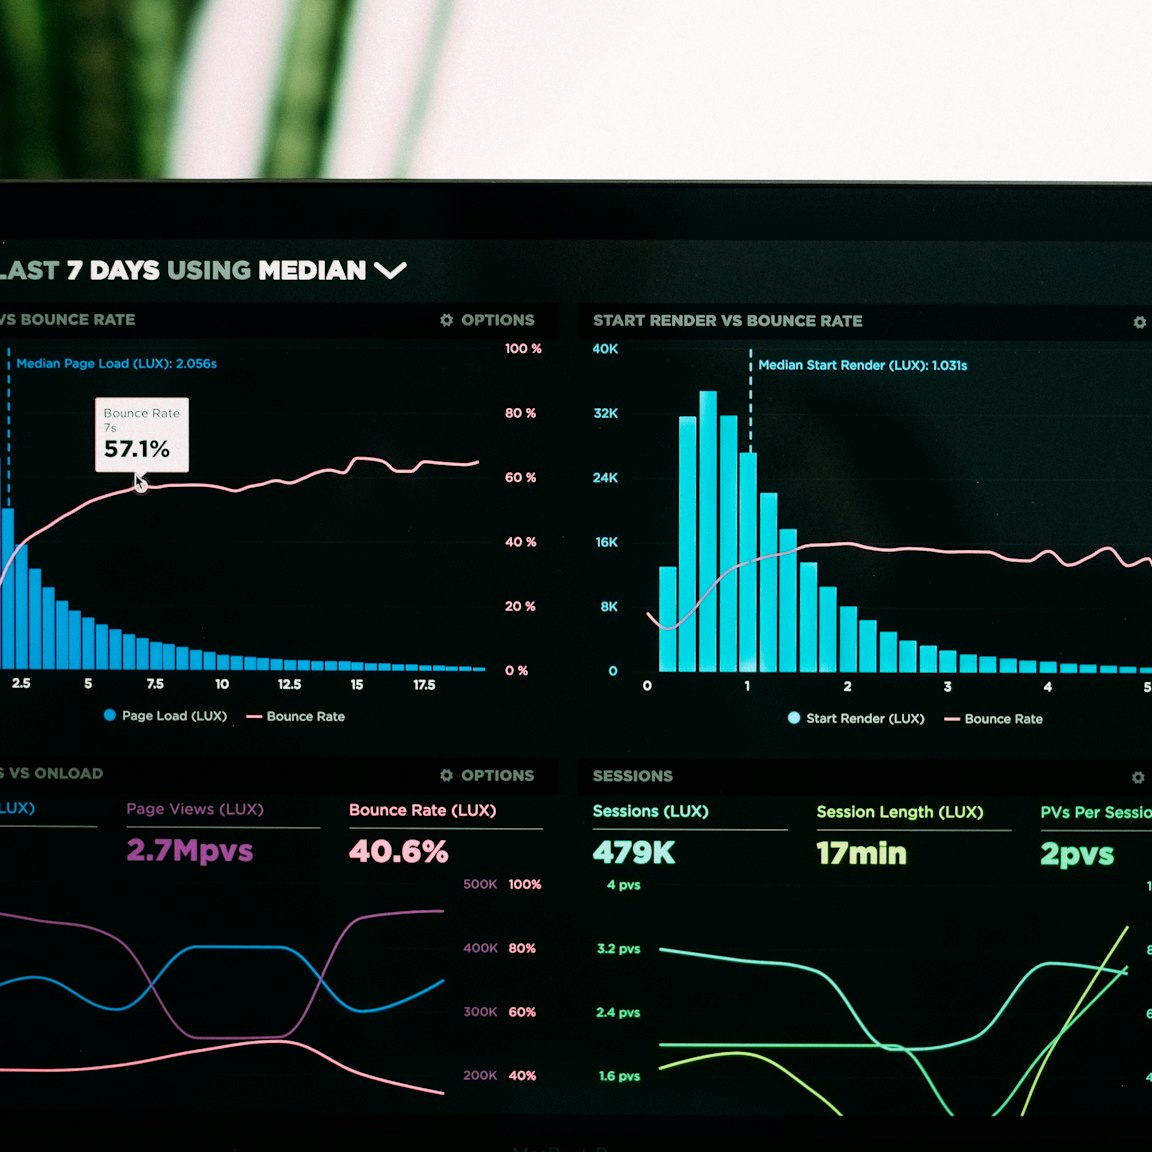
 Chart.js Dashboard in Nuxt.js
 Chart.js Pages in Nuxt.js
Source Code and Demo
To view the source code from the above example you can visit GitHub and here is the live demo on how to add Chart.js into Nuxt.js web application dashboard.
There are several ways to deploy your Nuxt.js and Chart.js application dashboard, you could use any hosting service provider or use free static website hosting like Vercel and Netlify.
I have been using these hosting service provider for quite some time for publish several of my web projects. As a web developer, these hosting providers have been extremely helpful in terms of hosting my static websites.
For private server deployment, you can utilize PM2 for Node.js process management when deploying your Nuxt.js or Next.js web application. You can find more information in our blog here.
Thanks for stopping by and reading this. Cheers!
Topics
Recent Blog List Content:
Most popular React.js UI Libraries - Exploring Mantine and Material-UI

How To Work With Relationship RESTful API Endpoints In React.js
Archive
Stories
Code Road’s Web Development Story List
Code Road
Material UI Administrator Dashboard with Next.js
Code Road
Nuxt.js and Chakra UI Website Template
Code Road
How To Use Apex Charts in Nuxt.js Web Application Dashboard
Code Road
Nuxt.js Dynamic Sitemap and Feed for Static Websites
Code Road
Nuxt.js SEO Head Component
Code Road
Chart.js in Nuxt.js: How To Implement
Code Road
On-page SEO List to Have in your Nuxt.js Static Website
Code Road
How To Build VueJS Geo Location Weather Application
Code Road
MySQL Docker Container with MySQL Workbench and PhpMyAdmin
Code Road